Preview JS/CSS files loading on frontend & appearing in PageSpeed Insights – causing performance issues

Hi Brizy Team,
We’re facing a performance issue on our live website that seems to be coming from Brizy preview-related JS/CSS files loading on the frontend.
When we run Google PageSpeed Insights, we consistently see Brizy preview JS files like:
-
preview.pro.min.js -
group-1_2.min.js
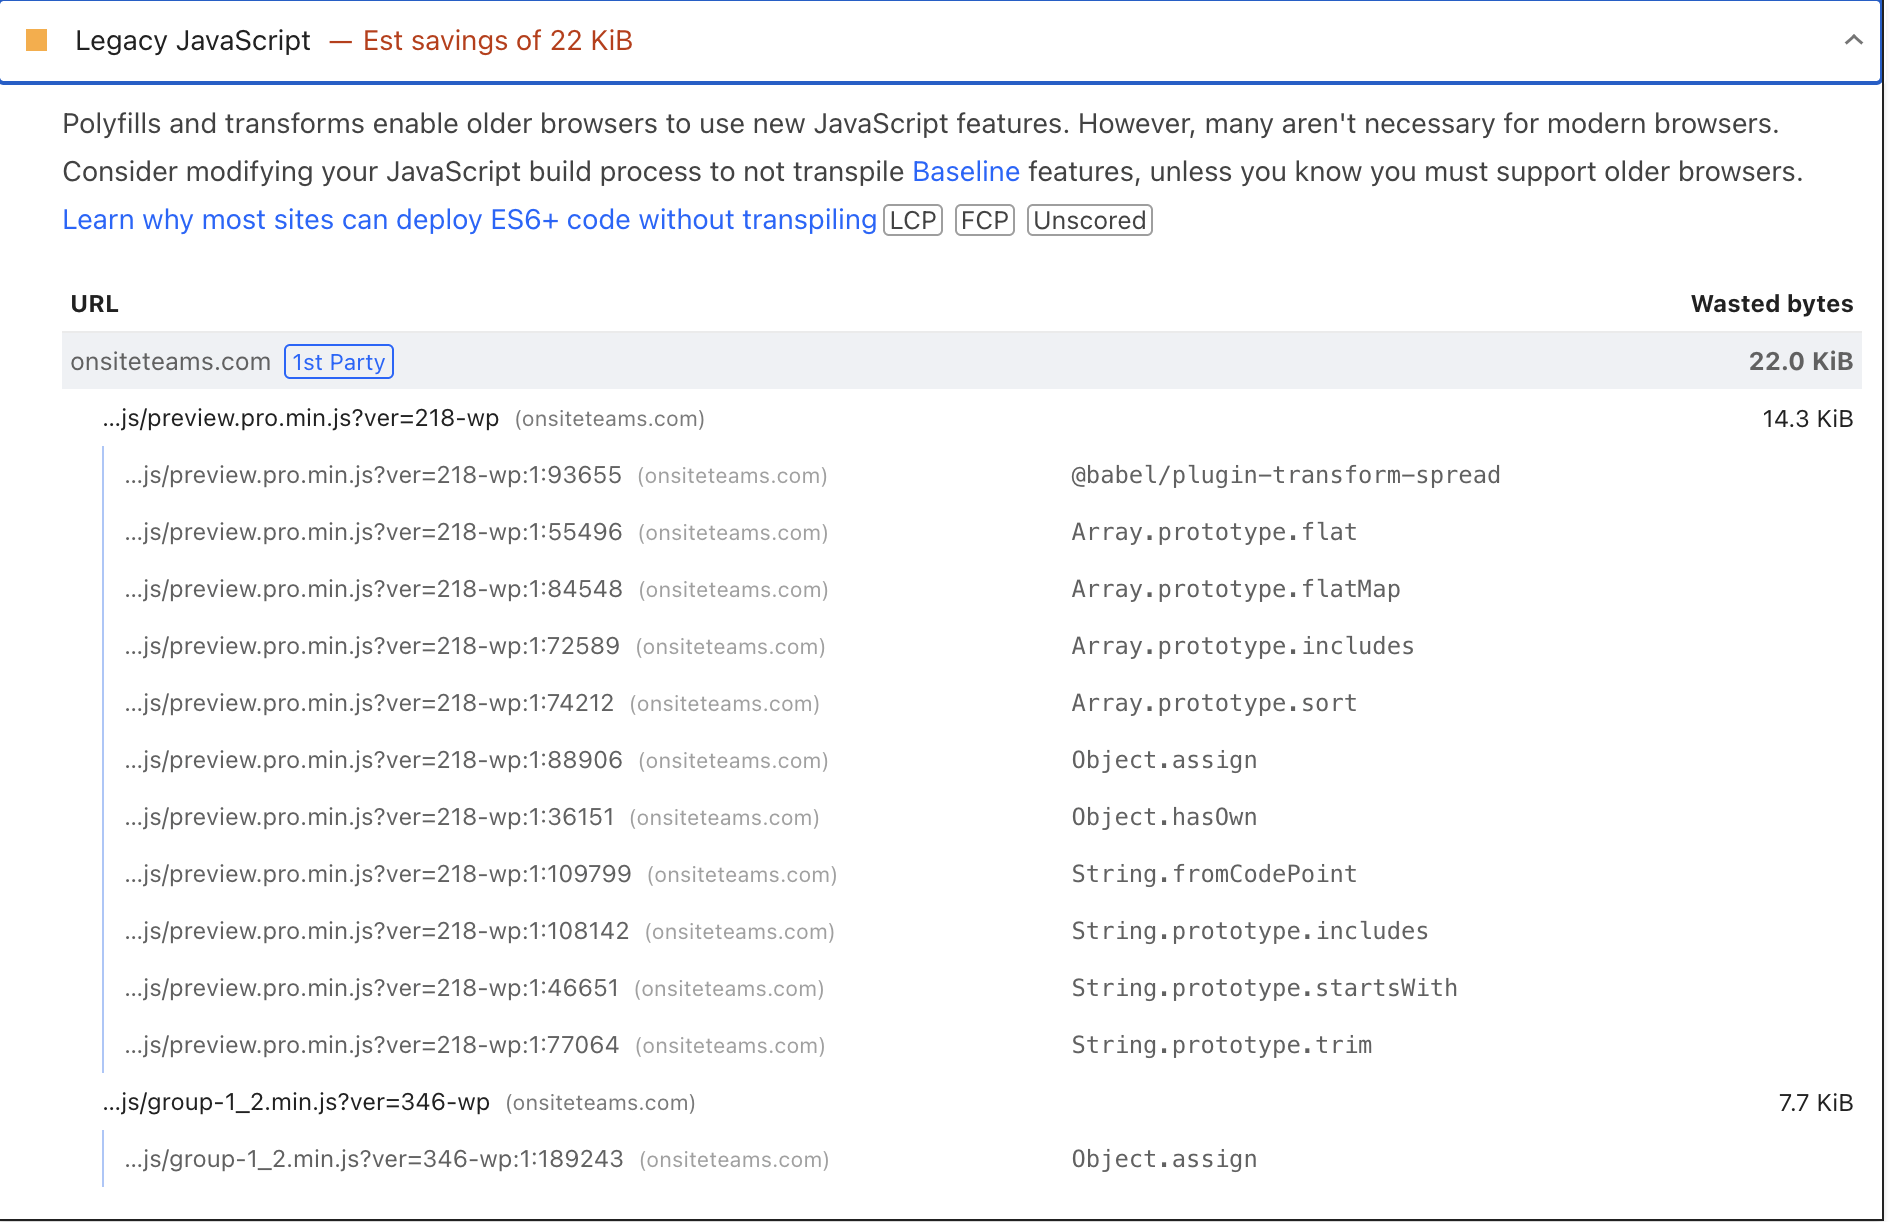
These files are being flagged under “Legacy JavaScript”, with unnecessary polyfills such as:
-
Array.prototype.flat -
Array.prototype.includes -
Object.assign -
String.prototype.includes -
String.prototype.startsWith -
etc.
This results in ~22KB of wasted JS, increases render-blocking time, and negatively impacts LCP and overall performance scores.
Key concerns:
-
These appear to be preview/editor-related assets
-
They are loading on the live frontend, not just in the editor
-
They are being detected as 1st-party legacy JavaScript
-
This is slowing down our production site
Environment:
-
WordPress (latest version)
-
Brizy Pro (paid version)
-
Blocksy Pro theme
-
Caching enabled (issue persists even after cache clear)
What we need help with:
-
Why are preview/editor JS files loading on the frontend?
-
Is this expected behavior, or a known issue?
-
Is there a way to disable or defer preview-related JS/CSS for non-editor users?
-
Are you planning a fix or optimization in upcoming updates to prevent this?
We’ve confirmed that these files disappear when Brizy-related features are disabled, so the issue is isolated to Brizy.
This is critical for us because performance and Core Web Vitals are a major priority for SEO and UX.
Looking forward to your guidance or confirmation on whether a fix is planned.
Thanks,
Shikhar
(Onsite – Brizy Pro User)
-

Hello Shikhar,
I checked the performance of your website using GT Metrix and the score looks resonably good. You can see the report at https://gtmetrix.com/reports/onsiteteams.com/gJPgcM1T/
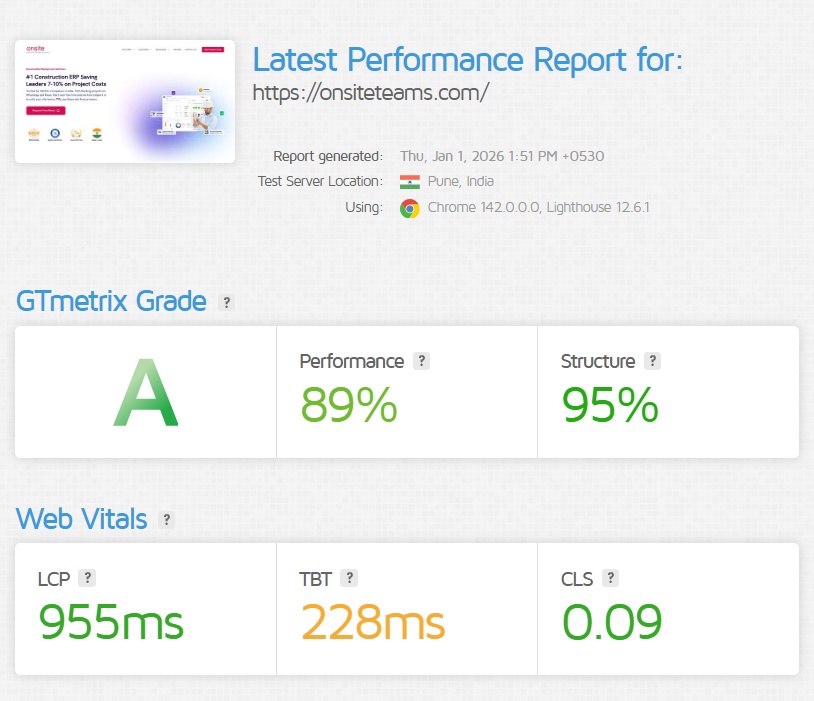
A good website speed is generally considered under 2-3 seconds. I tested the visual loading speed of your website from India. See my test at https://jmp.sh/q0tCOSXV Your homepage loaded within a second.
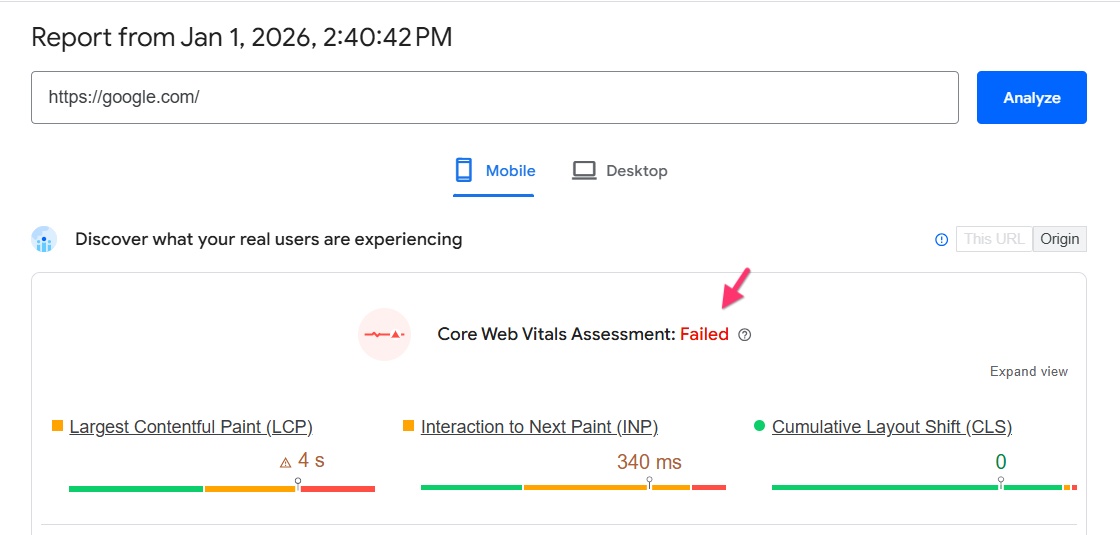
Your Page Speed Insights score also looks good. Let's compare the PSI score of https://google.com/ with yours. When Google's homepage conten is just a logo and a search form filed, your website homepage has far more content with 32 images, multiple forms etc.. Yet, your website score is same as that of Google.com's. Congratulations.
- https://www.google.com/: 86 (https://pagespeed.web.dev/analysis/https-google-com/iay87ovya2?form_factor=mobile)
- https://onsiteteams.com/: 86 (https://pagespeed.web.dev/analysis/https-onsiteteams-com/g2kk11v5u8?form_factor=mobile
About the performance issue coming from preview.pro.min.js and group-1_2.min.js, we may not be able to do much about it since it is to do with the how Brizy is currently designed to work. About Core Web Vitals, you may find it interesting that Google.com does not pass it either.
 0
0
Please sign in to leave a comment.
Comments
1 comment